Drought Status Overview
-
What does this dashboard relate to:
It relates to the assessments of impact of drought and risks management. In order to monitor and manage drought risk, the specific indicators such as precipitation, streamflow, reservoir levels, groundwater levels, and vegetation condition may be used. Thus, drought information systems must have the capability to provide integrated information derived from various indicators. The Drought Status information system is designed to provide regular overview and outlook of drought status in South Africa to water sector decision makers, as well sector wide stakeholders.
In the Drought Status dashboard, the Multi Criteria Decision Analysis (MCDA) method is currently used to integrate rainfall, river flow, dam levels and groundwater level data as the main indicators for generating up to date hydrological drought status information. The Multi Criteria Decision Analysis (MCDA) equation used is given as follows;

Where U(0) = Average score for the drought status overview or outlook, U(Hi ) = Score of the ith Drought Indicator, βi = Degree of belief for the i^th Drought Indicator.
In the Drought Status and Risk Management dashboard, the satellite based vegetation condition index is used to generate up to date agricultural drought status information. The Vegetation Condition Index (VCI) is based on the comparative Normalized Difference Vegetation Index (NDVI) change with respect to minimum historical NDVI value. Therefore, the VCI will compare the recent Vegetation Index (VI) such as NDVI or Enhanced Vegetation Index (EVI) to the values observed on the same period as in previous years within a specific pixel. The VCI is calculated as shown below,

Where: VCIijk is the VCI value for the pixel i during month j for year k, VIijk is the monthly vegetation index (VI) value for pixel i in month j for year k whereby both the NDVI utilized as the VI, VIi, min and VIi,max are the multiyear minimum and maximum VI, respectively, for pixel i.
The resulting percentage of the observed value is situated between the extreme values (minimum and maximum) in the previous years. Lower and higher values therefore indicate bad and good vegetation state conditions, respectively.
The Land cover overview is based on the South African National Land-Cover 2018 dataset (provided by the Department of Environmental Affairs), which was generated from multi-seasonal Sentinel-2 satellite imagery and available under an open-source license agreement. The term of use governing the original data apply and can be found on https://egis.environment.gov.za/gis_data_downloads.
-
What information does the Dashboard aim to Disseminate? What questions does this dashboard aim to answer?
The dashboard aims to answer the following questions:What information does the Dashboard aim to Disseminate? What questions does this dashboard aim to answer? Trend Indicators Vegetation Condition Index (VCI) Vegetation Condition Index → National and Provincial state of Vegetation in RSA What is the current National and Provincial state of Vegetation Condition in RSA? 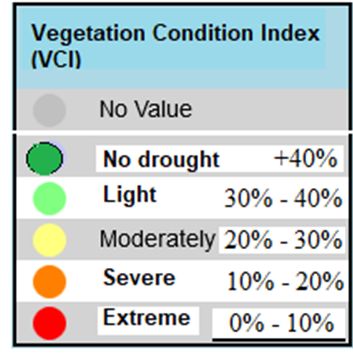
Vegetation Condition Index (VCI) based on the relative Normalized Difference Vegetation Index (NDVI) What information does the Dashboard aim to Disseminate? What questions does this dashboard aim to answer? Trend Indicators Multiple Criteria Decision Analysis (MCDA) Rainfall Status Overview → National and Provincial state of rainfall in RSA What is the current National and Provincial state of rainfall in RSA? 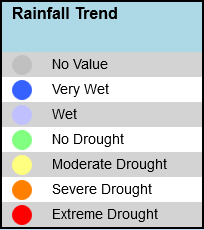
Allocated MCDA Number
1 ≅ Very Low
2 ≅ Low
3 ≅ Moderately Low
4 ≅ Normal
5 ≅ Moderately High
6 ≅ High
Runoff Status Overview → National and Provincial state of streamflow in RSA What is the current National and Provincial state of streamflow in RSA? 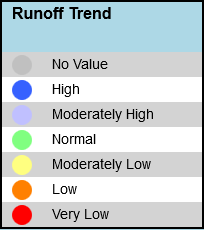
Allocated MCDA Number
1 ≅ Very Low
2 ≅ Low
3 ≅ Moderately Low
4 ≅ Normal
5 ≅ Moderately High
6 ≅ High
Dams Status Overview → National and Provincial state of dams in RSA What is the current National and Provincial state of dams in RSA? 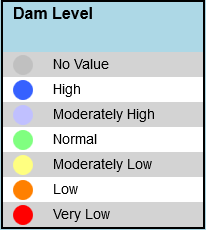
Allocated MCDA Number
1 ≅ Very Low
2 ≅ Low
3 ≅ Moderately Low
4 ≅ Normal
5 ≅ Moderately High
6 ≅ High
Groundwater Status Overview → National and Provincial state of groundwater in RSA What is the current National and Provincial state of groundwater in RSA? 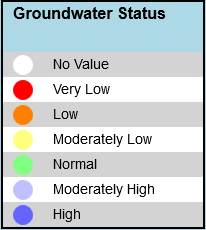
Allocated MCDA Number
1 ≅ Very Low
2 ≅ Low
3 ≅ Moderately Low
4 ≅ Normal
5 ≅ Moderately High
6 ≅ High
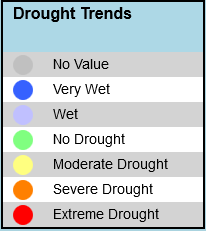
Drought Status Overview and Outlook → Current national and provincial state of drought in RSA → Outlook of the national and provincial state of drought in RSA What is the current state of drought in the Republic of South Africa (RSA), and what is the outlook? Drought Status Overview
Drought Status Outlook


Drought Status Overview (DSOv)
𝑫𝑺𝑶𝒗=𝒔𝒖𝒎( % 𝑰𝒏𝒅𝒊𝒄𝒂𝒕𝒐𝒓 x 𝑴𝑪𝑫𝑨 𝑵𝒖𝒎𝒃𝒆𝒓)
% Rainfall Indicator ≅ 15 % ≅ 0.15
% Runoff Indicator ≅ 15 % ≅ 0.15
% Dam Indicator ≅ 15 % ≅ 0.15
% Groundwater Indicator ≅ 15 % ≅ 0.15
1 - 1.833 ≅ Extreme Drought
1.833 - 2.667 ≅ Severe Drought ≅ 15 % ≅ 0.15
2.667 and 3.500 ≅ Moderate Drought ≅ 15 % ≅ 0.15
3.500 - 4.333 ≅ No Drought ≅ 15 % ≅ 0.15
4.333 - 5.167 ≅ Wet ≅ 15 % ≅ 0.15
5.167 - 6 ≅ Very Wet ≅ 15 % ≅ 0.15
Drought Status Outlook (DSOt)
𝑫𝑺𝑶𝒕=𝒔𝒖𝒎( % 𝑰𝒏𝒅𝒊𝒄𝒂𝒕𝒐𝒓 x 𝑴𝑪𝑫𝑨 𝑵𝒖𝒎𝒃𝒆𝒓)
% Rainfall Indicator ≅ 50 % ≅ 0.5
% Runoff Indicator ≅ 50 % ≅ 0.5
% Dam Indicator ≅ 0 % ≅ 0
% Groundwater Indicator ≅ 0 % ≅ 0
1 - 1.833 ≅ Declined
1 - 2.667 ≅ Stable
2.667 - 6 ≅ Improved
Drought Affected Settlements Which settlements in RSA are affected by moderate, severe and extreme drought? 
N/A -
Data Type, Source, Accessibility and Update Frequency
The dashboard aims to answer the following questions:
Data Type Data Source & Accessibility Data Update Frequency Conditions for Data Used Monthly Average Rainfall Data → DWS website (Incomplete)
→ HYDSTRA (Incomplete)
→ South African Weather Services (SAWS)→ Monthly → The DWS is not the sole data custodian.
→ The NIWIS developers are not responsible for the quality and integrity of the data used.Runoff Data → National and Provincial state of streamflow in RSA → DWS website
→ HYDSTRA→ Weekly, Monthly → Verified and unverified data may be used.
→ Where verified data is used, a delay in data update frequency may be experienced.
→ The NIWIS developers are not responsible for the quality and integrity of both the verified and unverified data used.Dams Data → National and Provincial state of dams in RSA → DWS website
→ HYDSTRA→ Weekly, Monthly → Verified and unverified data may be used.
→ Where verified data is used, a delay in data update frequency may be experienced.
→ The NIWIS developers are not responsible for the quality and integrity of both the verified and unverified data used.Groundwater Data → DWS website
→ HYDSTRA→ Monthly → Verified and unverified data may be used.
→ Where verified data is used, a delay in data update frequency may be experienced.
→ The NIWIS developers are not responsible for the quality and integrity of both the verified and unverified data used.Affected Settlement Data → Agricultural Research centre (ARC) → Monthly → The NIWIS developers are not responsible for the quality and integrity of the data used.
→ Data updated as and when available. -
Person(s) who championed the dashboard:
-
Mr Mxolisi Mukhawana
Department of Water and Sanitation (DWS)
Integrated Water Information Systems (IWIS)
-
Mr Kganyago Mahlatse
South African National Space Agency (SANSA)
-
Mr Kenneth Makhubele
Department of Water and Sanitation (DWS)
Water Services: Policy and Strategy
-
Mr Mxolisi Mukhawana
-
Enquiries:
- For all dashboard enquiries click HERE to go to the Contact Us page.
-
Links to other Sources of related Information:
http://www.dwa.gov.za/Hydrology/
http://www.dwa.gov.za/groundwater/
http://www.weathersa.co.za/
http://www.arc.agric.za/
https://www.sansa.org.za/products-services/earth-observation/
https://egis.environment.gov.za/sa_national_land_cover_datasets
-
Are there any limitations / cautions related to using this information?
The verification process of the data can take months to years.
Copyright: The copyright of the data/information remains with the Department of Water and Sanitation. This approval to use the data/information cannot be construed as a transfer of copyright.
Usage: All data is supplied free of charge and may not be sold to third parties. The use of information data is restricted to use for academic, research or personal purposes.
Quality: All data is supplied with no expressed or implied warranty as to its suitability for purpose, accuracy or completeness.
Status: Meanwhile data is continuously updated; the data set(s) supplied are already historical on the day of supply.
Acknowledgement: Whenever used in publications or the electronic media, the Department Water and Sanitation is to be mentioned as the proprietor of the relevant copyright.


