Resource Water Quality Objectives
-
What does this dashboard relate to?
This dashboard shows if Resource Water Quality Objectives (RWQOs) which have been set for 6 water quality parameters (i.e. electrical conductivity, pH, sulphate, chloride, phosphate, ammonia) for various geographic locations are being complied with or not. So in short, this is a compliance / non-compliance dashboard related to RWQOs. There may be cases where data is not available for all 6 water quality parameters. A “no value” indication is given when data is not available. RWQOs are set for a number of other water quality parameters. The 6 water quality parameters included in this dashboard have been chosen as they are likely to be of concern in all catchments.
-
What is the main purpose of the dashboard?
The dashboard highlights where (i.e. the geographic location) areas of non-compliance against the RWQOs with details of the type of water quality parameter/s that is/are not being complied with. The Department of Water and Sanitation will investigate areas where non-compliance against the RWQOs is taking place. It can take several weeks to months for the water quality data to be verified and made available for use. The implication is that this dashboard is not suited for day-to-day operational management decisions in catchments, but rather more for planning and oversight roles.
-
Does non-compliance against one or more of the 6 water quality parameters indicate a health risk to society?
No, not necessarily. The RWQOs may have been set to a very high standard. So non-compliance against the standard does not automatically mean there is a health hazard. It does indicate that the RWQO may have been set at an unrealistically strict level of protection for a given area, and/or that illegal activities may be taking place which contribute to the non-compliance. The non-compliance indicator serves as an alert to DWS to investigate the situation closer. Also bear in mind that it can take several months for water quality samples to be fully processed and for the readings to be uploaded to the information system (WMS) used to determine if the readings comply or don’t comply with the RWQO standards for the 6 water quality parameters. As the information may be a few months old it may not reflect the present water quality conditions.
-
Is the RWQO dashboard to be used for operational or for planning purposes?
It can take weeks to months for observed water quality readings to be verified and uploaded into the information system used to store this information (WMS). Given this fact, the information is not real-time or near-real time in nature, and is thus more suited for use in planning exercises. If the water quality readings are verified and uploaded with a short turn-around time, the dashboard could be used to help guide operational water management decisions.
-
Why are RWQOs set?
RWQOs are set to help ensure the protection of water resources. Once the water quality objectives are set, the water resources need to be managed so as to achieve the water quality objectives (targets). In certain river systems the ambition may be to have a very high level of protection, and high water quality objectives may be set. Other river systems may be seen as “working rivers”, and the water quality objectives may be set to a lower standard. In all cases the water quality objectives must be set at a level of protection that is strict enough so as not to compromise the health and safety of South Africans. The setting of the RWQO’s has an impact on the number and nature of water use licenses that can be issued in a catchment.
-
How by whom are the RWQOs set?
The RWQOs are set by the DWS following intensive stakeholder discussions and interactions. During these interactions the impact of various RWQOs on water use licensing is discussed. The review of the RWQOs will probably not take place in time period increments of less than 5 years.
-
For which geographic locations are the RWQOs set?
RWQOs are set to coincide with the geographic locations of water quality monitoring sites. RWQOs may be set for certain of these water quality monitoring sites, but not necessarily for all of them. The NIWIS RWQO dashboard gives an indication of the sites for which RWQOs exist. RWQOs are set for a stretch of a river, the actual upper and lower values for each RWQO depends on the users in that section, the biology as well as the natural condition.
-
Have RWQOs been set for the entire SA?
RWQO’s have been set for the whole of South Africa, however currently the RWQOs for the Upper Vaal have been captured into the WMS system
-
-
Person(s) who championed the dashboard:
-
Ms Lebo Mosoa
Water Resources: Planning Systems -
Mr Geert Grobler
Water Resources: Planning Systems -
Mr Pieter Viljoen
Water Resources: Planning Systems
-
Ms Lebo Mosoa
-
Enquiries:
- For all dashboard enquiries click HERE to go to the Contact Us page.
-
What type/s of questions does the information product aim to answer:
The primary question this information product aims to answer is… “where are the RWQO’s not being complied with in South Africa”. This helps to identify hot-spots, which can help direct investigations and further action.
-
Data / Information discussion:
-
What data is used?
There are two types of data required to generate this dashboard
- The first being the RWQOs which are set at different geographic locations for the 6 water quality parameters.
- The second is a time-series of verified observed water quality readings for the 6 water quality parameters.
-
How is data extracted and from where?
Water quality samples are taken and analysed by RQS on set intervals. Several water quality parameters can be measured from one sample. The water quality parameter results are validated, and then captured in the WMS database. The validation and upload into WMS can take a period of several months. A stored procedure (i.e. a script in the WMS database), which when initiated compares the values of the observed verified water quality readings against the RWQO’s. NIWIS initiates the stored procedure every Sunday evening.
-
How often is it extracted
Data is extracted monthly
-
Calculations done in NIWIS
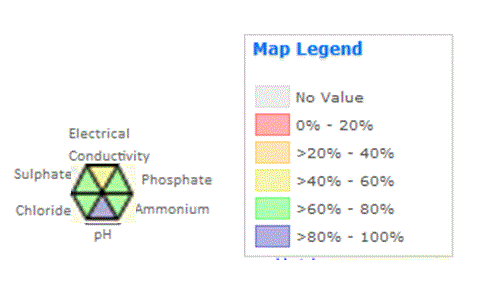
From the activation of the stored procedure in the WMS database, NIWIS captures a time-series of compliance or non-compliance for each of the 6 water quality parameters. A further calculation is then done in NIWIS to determine the percentage of readings that are compliant over a moving 12 month period.
- If no compliance value is observed (over the 12 month period), the icons on the map will be coloured grey.
- If 0-20% compliance is observed (over the 12 month period), the icons on the map will be coloured red.
- If a >20-40% compliance level is observed, then icons on the map will be coloured orange.
- If a >40-60% compliance level is observed, then icons on the map will be coloured yellow.
- If a >60-80% compliance level is observed, then icons on the map will be coloured green.
- If an >80-100% compliance level is observed, then icons on the map will be coloured blue.
A hexagonal icon has been developed to allow for 6 of the water quality parameters to be included in one icon. The hexagon wedges (slices) are then coloured to show the percentage level of compliance as described above.

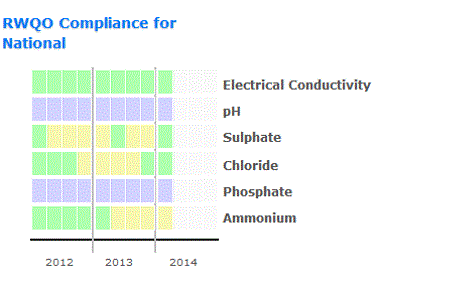
In addition to the 12-month calculations undertaken for the icons on the map, icons are developed to show the quarterly performance, using the same colour coding as detailed above.
-
Key assumptions made
- That the observed water quality readings have been correctly verified, and that not errors or omissions have taken place when storing the information into WMS.
- That the RWQO standards have been appropriately captured in WMS
- That the calculation procedures to determine compliance or non-compliance are being done correctly
-
What data is used?
-
Links to other sources of related information
- A link to information related to the South African water quality guidelines, 1996 can be found at:South African water quality guidelines, 1996
- A link to Reserve Determination Measures (RDM) can be found at:Reserve Determination Measures
-
Are there any limitations / cautions related to using this information?
Yes, please refer to the below:
- The verification process of the data can take weeks to months. The implication is that data is not real-time or near-real time.
- There could be errors in the data (i.e. the verification process, and/or the storing process).
- The RWQOs have not been captured for the entire country in WMS yet.
- The RWQO Dashboard only considers 6 water quality parameters.
Copyright: The copyright of the data/information remains with the Department of Water and Sanitation. This approval to use the data/information cannot be construed as a transfer of copyright.
Usage: All data is supplied free of charge and may not be sold to third parties. The use of information data is restricted to use for academic, research or personal purposes.
Quality: All data is supplied with no expressed or implied warranty as to its suitability for purpose, accuracy or completeness.
Status: Meanwhile data is continuously updated; the data set(s) supplied are already historical on the day of supply.
Acknowledgement: Whenever used in publications or the electronic media, the Department Water and Sanitation is to be mentioned as the proprietor of the relevant copyright.


