River Flows
The Surface Water Flows dashboard indicates the water flows in the rivers.-
What does this dashboard relate to:
This dashboard relates to flows in South African rivers. This dashboard is an integrated dashboard which shows:
- Count of gauges within defined thresholds at national, WMA, and Qauternary levels
- Historically observed and verified river flow data
- Unverified real-time data, and
- Flow timeseries as compared to the band of thresholds
-
What is the main purpose of the dashboard?
The main purpose is to show the current flows (unverified real-time data), statistics of verified data, and in a graph format to compare timeseries of gauge against historically observed flow thresholds. A review of the graph will thus indicate if the current flows are higher than, lower than or similar to average flow conditions observed for the same time of the year in previous years. This information can help water users and water managers with operational decisions related to water.
-
Person(s) who championed the dashboard:
-
Mr Musariri Musariri
Scientific Manager Hydrological Services
-
Mr Musariri Musariri
-
Enquiries:
- For all dashboard enquiries click HERE to go to the Contact Us page.
-
What type/s of questions does the information product aim to answer:
The dashboard aims to answer the following questions:- What are the real time (unverified) observed flows
- What are the historical verified observed flows for the past hydrological year
- How do the current flows compare to the observed flows of the past (for the same month)
- What is the count of gauges below and above Normal flow levels at national, WMA and Quaternary levels
-
Data / Information discussion:
-
Data used to generate the information
-
What data is used?
- The historically observed and validated data resides in the HYDSTRA database
- The unverified real-time data resides in the FLOOD MANAGEMENT SYSTEM database
-
Which weirs (flow gauging stations) are included in this dashboard?
-
The weirs were selected using the following criteria:
- If the flow gauges are real-time enabled, they are included. There are 77? real-time enabled flow gauges.
- Flow gauges that are not real time enabled will also be considered, but due to the large number of these gauges only a select few will be prioritised for inclusion in the dashboard.
- The weirs have to have a long data set
- The weirs have to be currently operational
- Where a few weirs exist in close proximity to one another, the most suitable option is identified.
-
The weirs were selected using the following criteria:
-
How is it extracted and from where?
- A script is run annually to determine the flow percentiles of observed flows in the Hydstra database. The percentiles include the 99%, 90%, 75%, 50%, 25%, 1%. The percentiles are then captured in NIWIS.
- A second script is run weekly which captures the time series of observed flows verified flows uploaded to HYDSTRA since the previous week
- A script is run to collect the real-time observed flow data. The data is only captured for the flow (or nearest recorded flow) to 6am, 12pm, 6pm, 12am
-
Data Processing in NIWIS
The data is updated annually on 1 April but can be extracted by NIWIS as and when required through the Macro Planning processes and procedures provided.In NIWIS a plot is made of the historically observed (and verified) flows for the current hydrological year, as well as the unverified real-time information against the percentiles of past years. The percentiles are computed for each month of the year.
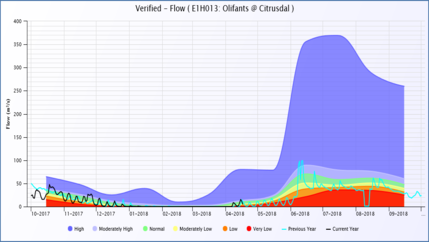
The diagram below illustrates what is shown in NIWIS.

-
Flow Levels
- High Flow: 100th Percentile (The highest flow in data set for the month)
- Moderately High: 75th Percentile
- Normal: 60th Percentile
- Moderately Low: 40th Percentile
- Low: 25th Percentile
- Very Low: 10th Percentile
A percentile is a measure used in statistics indicating the value below which a given percentage of observations in a group of observations fall. For example, the 20th percentile is the value (or score) below which 20 percent of the observations may be found.
Percentile - Wikipedia -
Key Assumptions
- That the observed flow readings have been correctly verified, and that no errors or omissions have taken place when storing the information into HYDSTRA.
-
What data is used?
-
Data used to generate the information
-
Are there any limitations / cautions related to using this information?
Yes, please refer to the below:
The real time data is not verified. One has to be cautious when using the data.
Copyright: The copyright of the data/information remains with the Department of Water and Sanitation. This approval to use the data/information cannot be construed as a transfer of copyright.
Usage: All data is supplied free of charge and may not be sold to third parties. The use of information data is restricted to use for academic, research or personal purposes.
Quality: All data is supplied with no expressed or implied warranty as to its suitability for purpose, accuracy or completeness.
Status: Meanwhile data is continuously updated; the data set(s) supplied are already historical on the day of supply.
Acknowledgement: Whenever used in publications or the electronic media, the Department Water and Sanitation is to be mentioned as the proprietor of the relevant copyright.


