Water Transfers
-
What does this dashboard relate to?
The dashboard relates to water transferred between different catchments thought the major bulk water transfer schemes in South Africa. The dashboards also shows the water flowing across South African borders in major river basins that are shared with neighbouring countries.
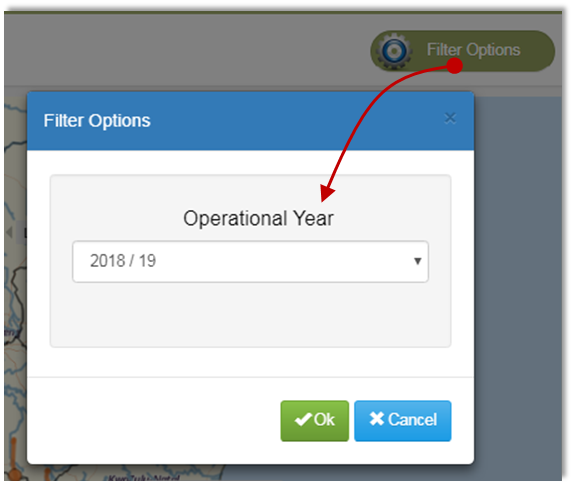
The different operational years are in the dashboard ‘Filter Options’, please see below:

-
What is the main purpose of dashboard?
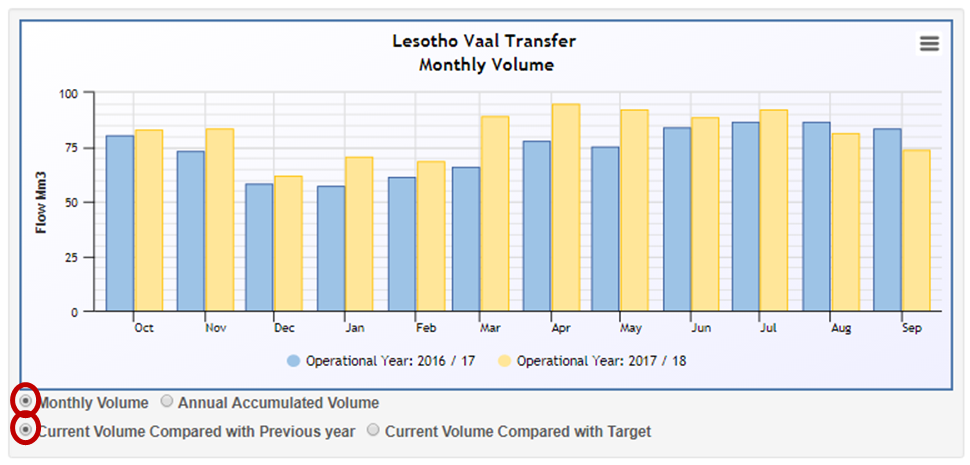
The purpose of the dashboard is to raise awareness to the major water transfer schemes in South Africa, as well as provide data for how much water is being transferred through these schemes. The data presents different charts that allow for comparison relative to last operational year, as well as comparisons to the planned target transfer that was defined. Data is presented in the map, table and charts.
Accumulated water transfer relative to previous year
Monthly water transfer relative to previous year

-
Person(s) who championed the dashboard:
-
Ms. Celiwe Ntuli,
Directorate: Water Resource Planning Systems (Systems Operation)
-
Ms. Celiwe Ntuli,
Directorate: Water Resource Planning Systems (Systems Operation)
-
Enquiries:
- For all dashboard enquiries click HERE to go to the Contact Us page.
-
What types of questions does the information product aim to answer?
The dashboard allows users to easily check the status of actual water flow volumes compared to the target flow volumes at critical water transfer locations in South Africa. The typical questions that the dashboard aims to answer include:
- Where are the major water transfer schemes in South Africa?
- Which water transfers in South Africa have flow volumes larger than the defined target volume?
- What is the difference in water volume between actual transfer and target transfer?
- How does the current transfer volume compare with the volume of water transferred in the previous operational years?
-
Data / Information Discussion
-
What data is used?
The data for the target water transfer is supplied by the Systems Operation sub directorate in the Water Resource Planning Systems Directorate. The observed water transfer volume data is extracted from the Hydstra Database for the monitoring points that are used to calculate the transfer volume.
-
How is data extracted and what is the source?
The data is extracted from Hydstra database with an automated script. The water transfer target data is updated by the business unit in predefined spreadsheet. The data is imported from this spreadsheet on a monthly basis.
Users should note that the verified data from Hydstra normally has a 2-3 month delay to allow for the data import and auditing process to take place. Therefore the most recent observed data will typically be 2-3 months behind the current date.
-
Key assumptions made
- The dashboards only show results for Water Transfers monitoring sites that are still active and continue to be monitored by DWS. There are many more Water Transfers samples available in the database, but they are not included in this dashboard.
- All data available is as captured into the Water Management System (WMS).
-
What data is used?
-
Links to other sources of related information
Users are encouraged to access different documentation related to the operation of bulk water transfer schemes in South Africa from the Integrated Water Resource Planning document portal:
- Click here to access the National Groundwater Archive (NGA) Link.
Users are also able to download the verified data from any of the water transfer points by accessing the verified data access portal.
- Click here to access the verified data access portal Link.
-
Are there any limitations / cautions related to using this information?
Yes, please refer to the below:
The real time data is not verified. One has to be cautious when using the data.
Copyright: The copyright of the data/information remains with the Department of Water and Sanitation. This approval to use the data/information cannot be construed as a transfer of copyright.
Usage: All data is supplied free of charge and may not be sold to third parties. The use of information data is restricted to use for academic, research or personal purposes.
Quality: All data is supplied with no expressed or implied warranty as to its suitability for purpose, accuracy or completeness.
Status: Meanwhile data is continuously updated; the data set(s) supplied are already historical on the day of supply.
Acknowledgement: Whenever used in publications or the electronic media, the Department Water and Sanitation is to be mentioned as the proprietor of the relevant copyright.


