Water Quality Monitoring Network
-
What does this dashboard relate to :
Functioning aquatic ecosystems and an adequate supply of usable water are fundamental to the survival and development of any nation, and particularly so for water-stressed countries like South Africa. The term useable is directly associated to the quality of water, which needs to be of an acceptable standard. Extensive monitoring programs are required for DWS to monitor the status of water quality in South Africa, and the objective of this dashboard is to summarise the extent of this network.
-
What type/s of questions does the information product aim to answer:
-
The dashboard aims to provide information to help answer the following questions:
- Where are the points in South Africa where water quality is monitored, and for which the data is stored in the WMS?
- What is the breakdown of these locations in terms of the types of sites, such as rivers, dams, waste water treatment, water supply, etc.?
- Where are the active / non-active water quality monitoring points in South Africa?
- What is the available data at individual site level for point in the WMS system?
-
The dashboard aims to provide information to help answer the following questions:
-
Data / Information discussion:
-
What data is used?
The source data for this dashboard is the WMS system. The WMS is a suite of computer programmes developed for the Department of Water and Sanitation to provide information for water resource monitoring and management in South Africa.
-
How is it extracted and from where?
The data is extracted from WMS system managed by Resource Quality Information Services (RQIS) and exported to NIWIS. RQIS provides national water resource managers with aquatic resource data, technical information, guidelines and procedures that support the strategic and operational requirements for assessment and protection of water resource quality. Functioning aquatic ecosystems and an adequate supply of usable water are fundamental to the survival and development of any nation, and particularly so for water-stressed countries like South Africa. For more details on WMS and contacts for access to data, please visit www.dwaf.gov.za/iwqs/wms/.
-
How often is data extracted?
Data is extracted monthly.
-
What data is used?
-
Person(s) who championed the dashboard
-
Dr Nadene Slabbert, Director, Resource Quality Information Services
-
Dr Nadene Slabbert, Director, Resource Quality Information Services
-
Enquiries:
- For all dashboard enquiries click HERE to go to the Contact Us page.
-
Links to other sources of related information
The following link is for the RQIS and WMS website at DWS, with further links to relevant information about water quality monitoring done by DWS. There are also other information products available on the website.
-
Water Management System (WMS)
Steps to follow: Select the first model (dws_analysis_model). Then click on filters. Select a monitoring programme. Select a variable. Select the time period from the Calender. Then click on Map (and select a sub-category eg. Drinking-Health from the additional filter) or Graph
- www.dwaf.gov.za/iwqs/
- www.dwaf.gov.za/iwqs/wms/
- www.dwaf.gov.za/iwqs/gis_data/
-
Water Management System (WMS)
-
Are there any limitations / cautions related to using this information?
Yes, please refer to the below:
The water quality monitoring dashboard provides a snapshot of the WMS database and may lag behind the live database. The WMS database is the definitive data source. Please see above regarding WMS.
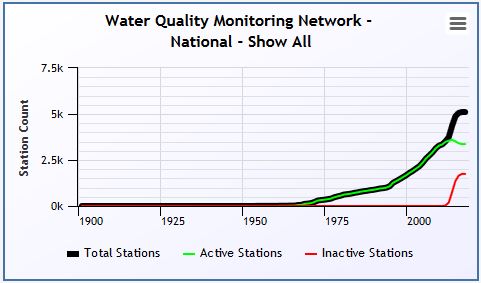
According to this wikipedia article, click here, "...the SI prefix for a thousand is kilo-, with the official symbol k—for instance, prefixed to "metre" or its symbol "m", kilometre or km signifies a thousand metres.
As such, people occasionally represent the number in a non-standard notation by replacing the last three zeros of the general numeral with "K": for instance, 30K for 30,000. Kindly note that, in the chart at, national view, there is reference to station data in the region of thousands of stations. As such the k symbol is then used in the chart legend as per the below, image as an example:

Copyright: The copyright of the data/information remains with the Department of Water and Sanitation. This approval to use the data/information cannot be construed as a transfer of copyright.
Usage: All data is supplied free of charge and may not be sold to third parties. The use of information data is restricted to use for academic, research or personal purposes.
Quality: All data is supplied with no expressed or implied warranty as to its suitability for purpose, accuracy or completeness.
Status: Meanwhile data is continuously updated; the data set(s) supplied are already historical on the day of supply.
Acknowledgement: Whenever used in publications or the electronic media, the Department Water and Sanitation is to be mentioned as the proprietor of the relevant copyright.


