Groundwater Quality
-
What does this dashboard relate to?
The dashboard relates to the quality of raw groundwater in South Africa, based on water quality sample data that is stored in the DWS Water Management System (WMS) database from the National Groundwater Quality Monitoring Programme (ZQM Stations). The dashboard shows the average concentration of four different water quality constituents (pH, EC, Nitrates, and Sulphates), for a date range that is defined by the user. The point-based groundwater quality data is also aggregated into the different geohydrological regions (as per Vegter (2001) Regions).
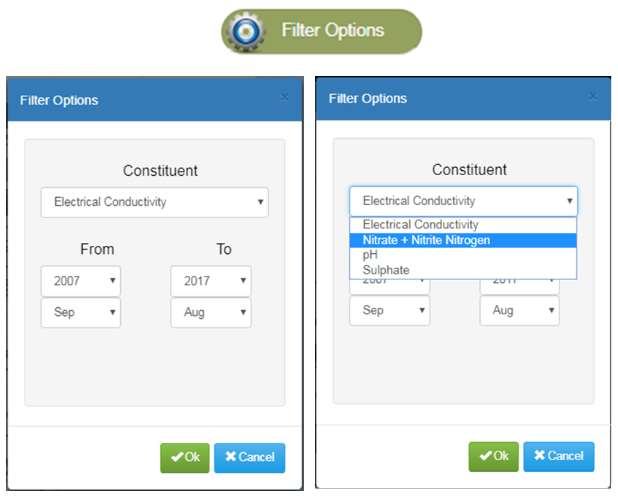
The different constituents and date periods are defined in the dashboard ‘Filter Options’, please see below:
-
What is the main purpose of dashboard?
The purpose of the dashboard is to provide the user with the general status of Groundwater Quality in South Africa at each monitoring point and aggregated up to Vegter Region using the data from the National Groundwater Quality Monitoring Programme (ZQM stations). The data that is available in the dashboard, interpreted through data table and different charts in the dashboard are:
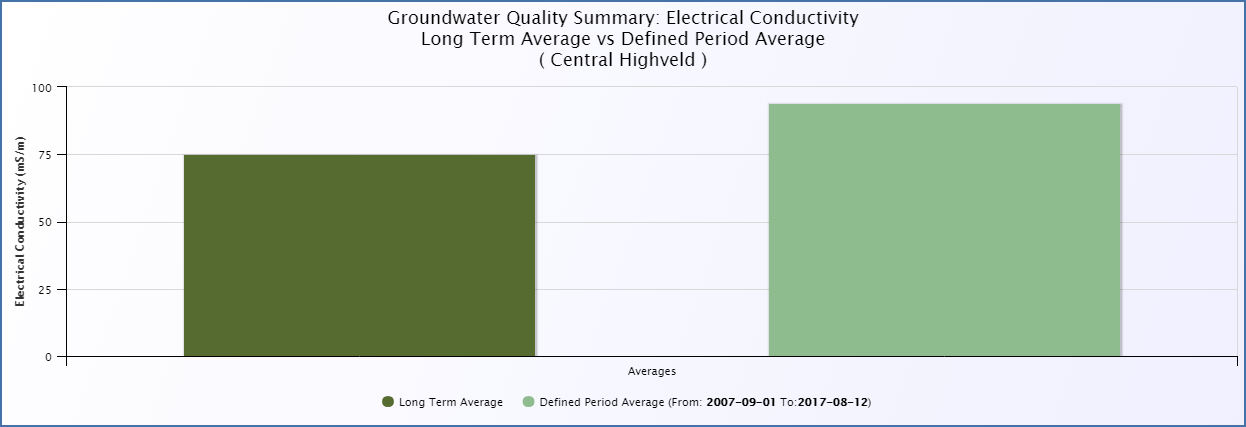
- Long term average vs defined period average
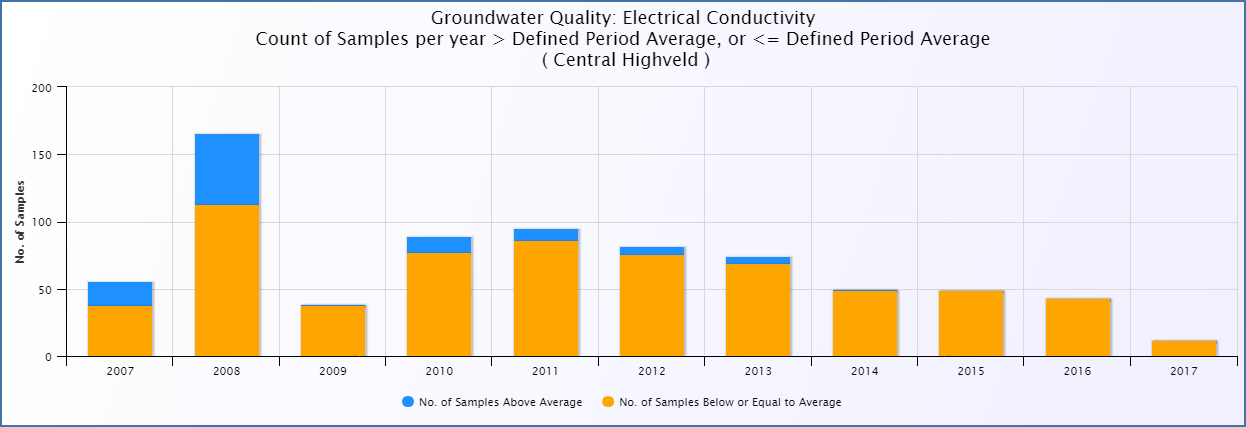
- Annual count of samples per year that are larger than, or less than equal, to the user defined date period average
- Annual Percentage of samples per year that are larger than, or less than equal, to defined date period average

- Annual count of samples per year that are larger than, or less than equal, to the entire long term period average
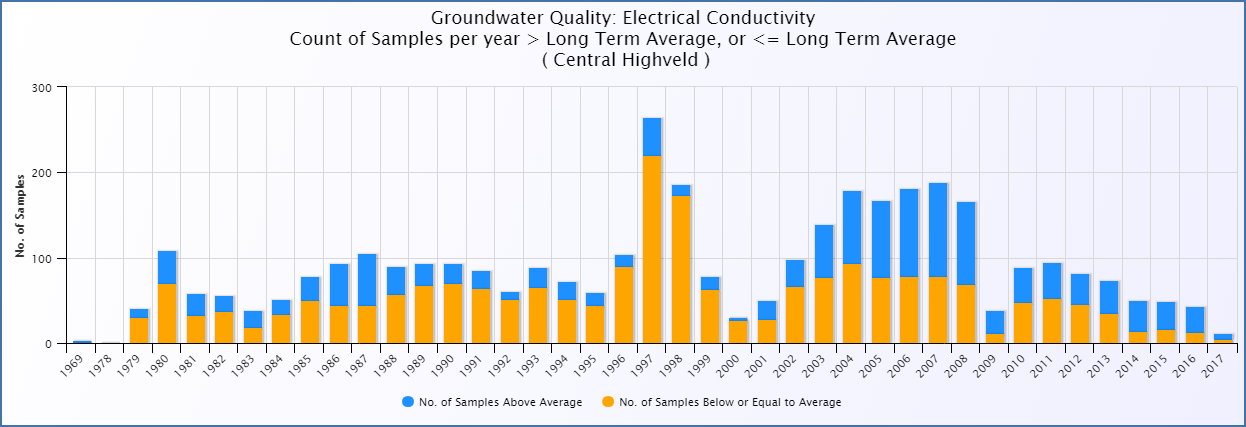
- Annual Percentage of samples per year that are larger than, or less than equal, to the entire long term period average

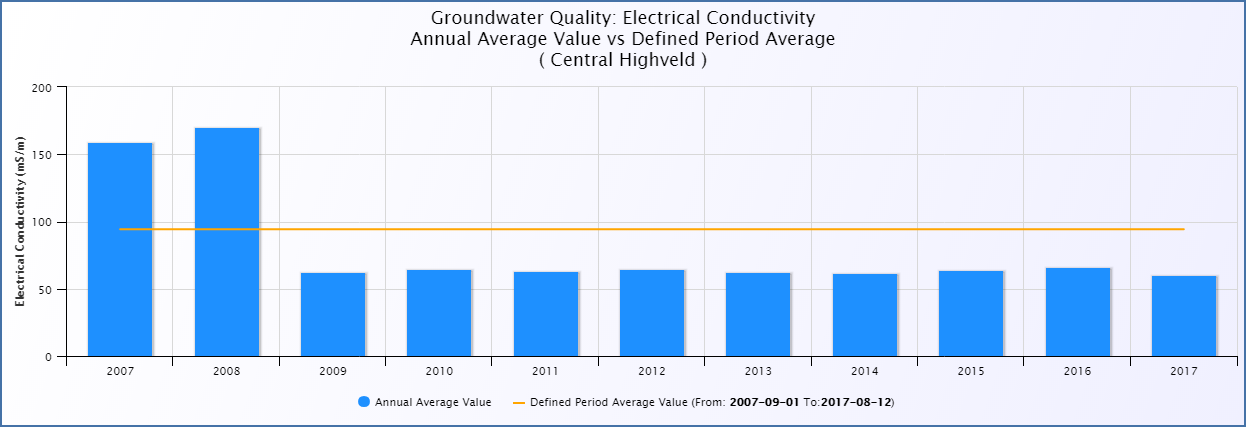
- Annual average per year vs. entire defined period average
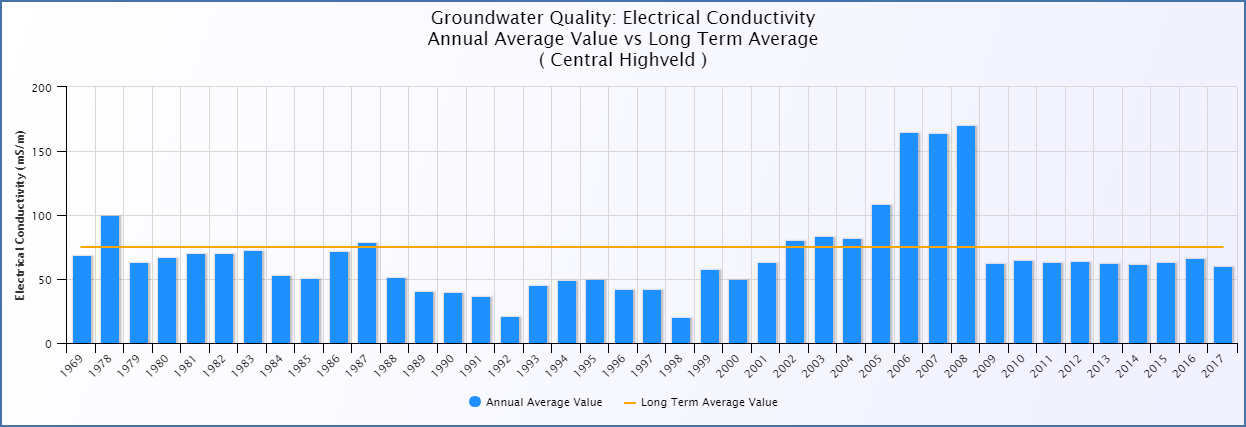
- Annual average per year vs. entire long term period average
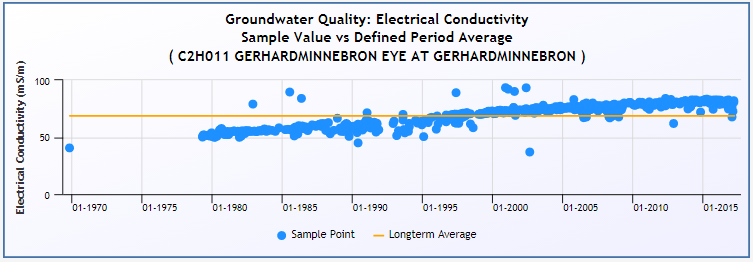
At an individual station level that actual sample data is displayed relative to the different averages (either defined period average, or long term average).
- Sample value vs. entire defined period average
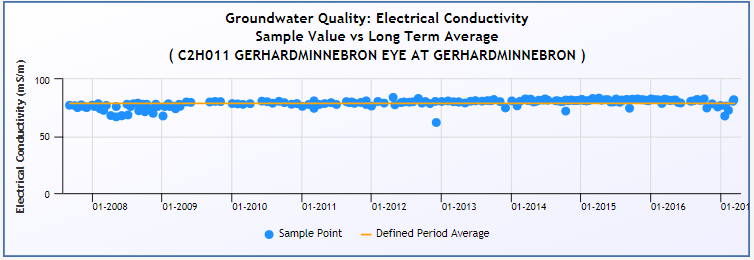
- Sample value vs. entire long term period average
-
Person(s) who championed the dashboard:
-
Mr Fhedzisani Ramusiya, Scientific Manager, Directorate: Surface and Groundwater Information, Emanzini Building Room 520
-
Mr Fhedzisani Ramusiya, Scientific Manager, Directorate: Surface and Groundwater Information, Emanzini Building Room 520
-
Enquiries:
- For all dashboard enquiries click HERE to go to the Contact Us page.
-
What types of questions does the information product aim to answer?
The dashboard allows a user to check changes in annual average concentration of groundwater quality in South Africa. Either at an aggregated Vegter Region level, or at an individual site level. The dashboards also illustrate the number of groundwater quality samples that have been analysed and stored in the WMS database.
-
Data / Information Discussion
-
What data is used?
Groundwater Quality data (pH, Sulphate, Electrical Conductivity and Nitrate + Nitrite Nitrogen) from the National Groundwater Quality Monitoring Programme captured on Water Management System is used and displayed for each Vegter (2001) geohydrological Region comparing the latest value with the average value over the full time period of data.
-
How is data extracted and what is the source?
The data from the WMS is extracted with a stored procedure executed on a monthly basis from NIWIS.
-
How is data extracted and what is the source?
Data is extracted monthly from the WMS database. Historical data from 1966 to current is available.
-
Data processing in NIWIS
The data for the chosen constituent at a monitoring point in a Vegter (2001) geohydrological region is averaged and aggregated up to Vegter (2001) geohydrological regions Level via stored procedures in the NIWIS database.
-
Key assumptions made
- The dashboards only show results for groundwater quality monitoring sites that are still active and continue to be monitored by DWS. There are many more groundwater quality samples available in the database, but they are not included in this dashboard.
- All data available is as captured into the Water Management System (WMS).
-
What data is used?
-
Links to other sources of related information.
Users are encouraged to access different groundwater related data that is available through the two DWS systems below:
-
Are there any limitations / cautions related to using this information?
Yes, please refer to the below:
The real time data is not verified. One has to be cautious when using the data.
Copyright: The copyright of the data/information remains with the Department of Water and Sanitation. This approval to use the data/information cannot be construed as a transfer of copyright.
Usage: All data is supplied free of charge and may not be sold to third parties. The use of information data is restricted to use for academic, research or personal purposes.
Quality: All data is supplied with no expressed or implied warranty as to its suitability for purpose, accuracy or completeness.
Status: Meanwhile data is continuously updated; the data set(s) supplied are already historical on the day of supply.
Acknowledgement: Whenever used in publications or the electronic media, the Department Water and Sanitation is to be mentioned as the proprietor of the relevant copyright.


